Helicon Ape incorporates a profound tool for debugging of web-sites as well as .htaccess files, e.g. rewrite, proxy and other directives in your httpd.conf, .htaccess and .htpasswd files. The debugger will show how the server processes your requests in real time while you are navigating web site in the browser window. For each server request it presents following information:
- request and response headers,
- cookies,
- server variables,
- environment variables,
- merged httpd.conf and .htaccess files,
- Ape debugging log messages with maximum verbosity.
Debugger shows verbose information not only for successful requests (status code 200), but also all others: redirects 3xx, client-side errors 4xx, server errors 5xx.
This debugger allows you to connect to a remote server and read debug information live. Only your session requests will be presented in the debugger window so other user requests will not be affected. This means you can run debugging in production environment.
Launching the debugger
To run the debugger mod_developer module should be enabled. The following line in httpd.conf should be uncommented to ensure this:
LoadModule developer_module modules/mod_developer.soThen:
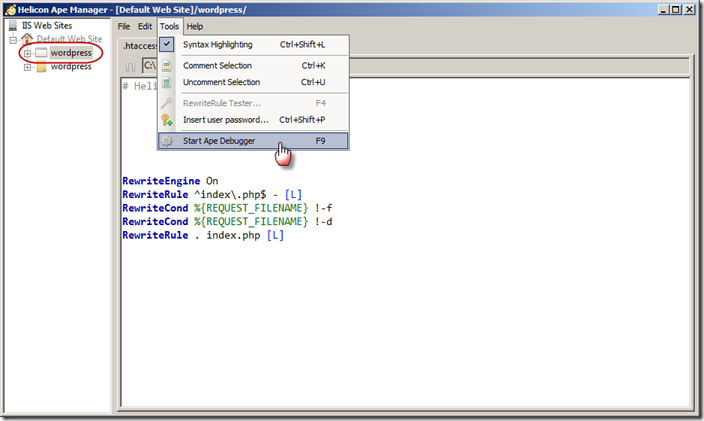
- run Helicon Ape Manager
- select the site or application to debug
- select Tools –> Start Ape Debugger

The result will be the following:
- a new browser window will open with the site or application selected for debugging; you’ll be able to browse the pages, perform AJAX-requests etc.
- the Debugger tab will be opened in Ape Manager and will show the requests log.
Functionality
The Debugger tab shows the log of all your requests to the site or application being debugged. The log includes the following info about each request: the path, status code, content-type and processing time in IIS.
Click on the line in the log and you’ll see detailed information about the request: request and response headers, cookies, server variables, environment variables, applied httpd.conf and merged .htaccess rules, corresponding error.log and rewrite.log records (if there are any for that request).
Headers:
.htaccess:
Logs:
The log with all debugging info may be opened directly in browser by clicking on the link ‘Open in browser’. Clicking ‘Clear log’ will remove all log entries.
To stop debugging click ‘Stop debugging’ or in Ape Manager choose Tools –> Stop Ape Debugger.
Security
The security of the debugging process is ensured as follows.
When debugging starts the following record is put in .htaccess:
SetEnv mod_developer secure-key-XXXXXXXXXXXwhere XXXXXXXXXXX is a secret randomly-generated key for access to debugging info. Upon the first request to debugging session the browser will send this key to the server and will get a cookie with this key and the id of the debugging session. All requests to the server with this cookie are logged. The same cookie is owned by web-interface of debugger (which is shown in Debugger tab). As a result, only authorized clients (browser and debugger) are allowed to make requests to be logged and receive them.
Upon termination of debugging (click on ‘Stop debugging’) the request to the server is sent and session id and all related log records are deleted. The cookie is reset. The previous cookie left in the browser becomes invalid, the logging stops.
Remote debugging
You can start .htaccess debugging on a server remotely. To do this you need to first put the line which sets mod_developer secure key into .htaccess file on your remote web site.
SetEnv mod_developer secure-key-XXXXXXXXXXXwhere XXXXXXXXXXX is any random numbers or text. Then open browser and type a link like this:
http://www.example.com/developer/_ape_start_developer_session?ape_debug=secure-key-XXXXXXXXXXX and use same value for XXXXXXXXXXX as you used in .htaccess file. This will start debugger window with “Waiting for data” message. This window also sets special cookie in the browser to identify your debugging session. Now open new tab in same browser and navigate to your web site. You will be reading debug information in the debug session window as you navigate through your web site live.